
Research notes / Raw-data audit
Missing SMART ages and the limits of drive-age comparisons
11 October 2026 / Q4 2025 observations / Reproducible extraction
Only 0.000347% of the selected drive-days lack a SMART age, yet those rows contain 2.01% of recorded failures. A small amount of missing data is not automatically an unimportant amount.
What the archive actually contains
We reprocessed all 92 daily CSVs for 1 October through 31 December 2025. The cohort keeps Hesela's existing filter, capacity_bytes >= 3e12, and counts each observed daily row as one drive-day. A failure is a row with failure = 1. This is a capacity-filtered cohort, not a universal rule for identifying HDDs or the same selection as every official Backblaze summary. [1] [2]
| Selection | Drive-days | Failure rows |
|---|---|---|
| Capacity-eligible, all age states | 30,575,777 | 945 |
| Finite nonnegative SMART 9 | 30,575,671 | 926 |
| Missing SMART 9 (excluded from age buckets) | 106 | 19 |
The age-complete rate is 1.105% per year; using all capacity-eligible rows gives 1.128%. Both use failures / drive_days × 36500. That comparison describes the effect of the age filter on the pooled rate. It does not tell us which age-specific rates are biased, because the excluded failure ages are unknown.
The archive audit found no additional nonfinite or negative SMART 9 values in this selected cohort. Zero is retained as a reported value; an empty field is not converted to zero. Counter resets and vendor encodings were not corrected.
Missing on the failure day is not a forecast
The excluded share is 19/945 failures, compared with 106/30,575,777 daily rows. Those unequal shares are a reason to examine the observation process. They do not establish that missing SMART data causes failure, that missingness is a useful early warning, or that the excluded records belong to a random sample.
These are same-day labels. Telemetry may be unavailable because a drive is already failing or because collection failed; this extraction cannot identify the mechanism or timing. Treating failure-day absence as an advance predictor would risk outcome leakage. Repeated records from the same drive also prevent interpreting every row as an independent device.
For age-specific analysis, keep the missing-age count explicit. Do not distribute its failures across buckets without a justified imputation model and sensitivity analysis. A Poisson interval describes count uncertainty conditional on a model; it does not repair systematic selection. See our AFR methods note.
A capacity label that excluded its own members
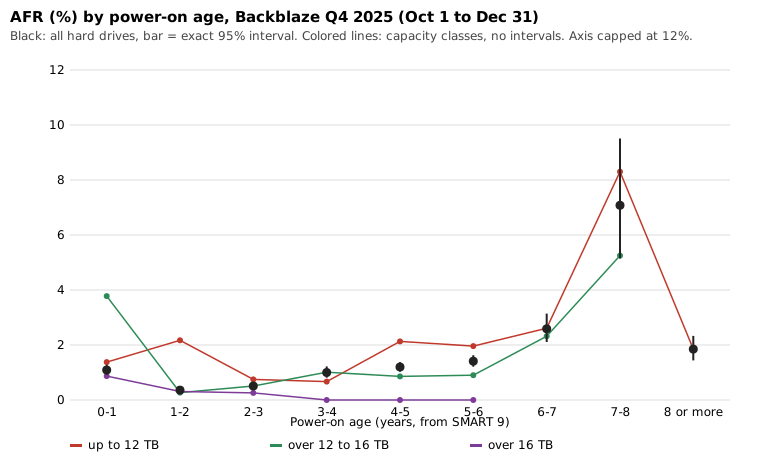
The old generator assigned every nominal capacity above 16 TB to a group labeled "20 TB and above". The raw audit finds 5,520 age-complete drive-days at 18 TB and 0 recorded failures. Those rows were already inside that group.
We corrected the labels to "up to 12 TB", "over 12 to 16 TB" and "over 16 TB", using the same rounded nominal-terabyte boundaries. Every one of the 32 published age-table rows keeps its counts, AFR and interval. This is a semantic correction, not evidence that large drives became more or less reliable.
Three questions that need different data
- How old were the failures we observed? The median age among failed drives describes those events in that window. It is not the age by which half of all drives fail.
- How many failures occurred per observed time at each age? Age-bucket AFR supplies exposure, but the models and operating conditions within each bucket still differ.
- How long does a drive survive from a defined starting point? That needs event-free follow-up as well as failures, an entry rule, an exit rule and assumptions about missing observations.
Right-censoring means follow-up ends before the event is observed: survival is known up to that point. Missing SMART age is a different problem, because a failure label can still be present. NIST explains the event-time distinction. [3]
Left-truncation, or delayed entry, arises when inclusion requires surviving until observation starts. Oakley and colleagues explicitly model this and right-censoring in their Backblaze study. Their likelihood conditions on entry age; their motivating example uses 4,707 drives of one anonymized model. That is methodological context, not a replication on our Q4 cohort. [4]
Their two-state likelihood makes the distinction concrete: a drive entering at age a and exiting at age t contributes h(t)^d S(t) / S(a), where d = 1 for failure and d = 0 for censoring. The denominator conditions on survival to entry. This relies on the paper's independence and non-informative observation assumptions; it does not recover an unobserved age. [4, section 3.2]
A useful detail in the 2026 literature
Siemroth and Park analyze 2013 through Q2 2025 with Cox and Weibull duration models. Section III reports 146,943 drives removed without failure; they retain these as right-censored observations. In section V.C, adding location availability changes the sample from 442,992 to 355,429 drives. Comparing models on that same smaller sample separates the location adjustment from the sample change. Their conclusion notes the lack of comparable workload measurements and limits generalization to newer devices. [5]
The practical lesson for this audit is to keep selection changes separate from model changes. Our missing-age comparison changes the records retained; it is not a controlled experiment on SMART or a ranking of manufacturers. Retirement decisions related to health would also need explicit treatment before extrapolating a survival curve.
Reproduce the audit
Download the Q4 2025 archive from Backblaze and the audit script. It uses Python 3.11 or newer and only the standard library, makes no network requests and never accesses a drive device.
python3 audit_backblaze_age.py data_Q4_2025.zip --output audit.jsonThe published JSON records archive and generator SHA-256 hashes, runtime version, dates, all age-bucket counts, capacity counts and exclusions by model. Repeated runs should match the counts and hashes; the run timestamp can differ. Serial numbers and infrastructure identifiers are not published.
Validation requires exactly 92 dated files, the expected columns, valid failure flags and no duplicate serial within a day. Regression fixtures cover missing, negative and nonfinite ages, zero age and capacity boundaries. The resulting counts reconcile to the existing table. The raw data remains subject to Backblaze's use terms; this release publishes derived aggregates and code, not a copy of the archive.
Sources and scope
- Backblaze: Hard Drive Reliability & Test Data (schema, archive and use terms)
- Hesela: Q4 2025 raw-archive age audit (counts, exclusions and SHA-256)
- NIST e-Handbook 8.1.3.1: Censoring
- Oakley, Forshaw, Philipson and Wilson (2024), Examining the impact of critical attributes on hard drive failure times, sections 1-3
- Siemroth and Park (2026), Are There Manufacturer Differences in Hard-Drive Reliability? IEEE TCC 14(2), 1015-1024; DOI 10.1109/TCC.2026.3679404; accepted manuscript sections III, IV, V.C and VII
Original work here: extraction validation, label correction and missingness accounting for one quarter. No hardware experiment, fitted survival model, causal estimate or reproduction of either paper's model is claimed.