
Research notes / Raw-data audit
SMART zeros, missing attributes and failure-day selection
11 October 2026 / Q4 2025 observations / Reproducible extraction
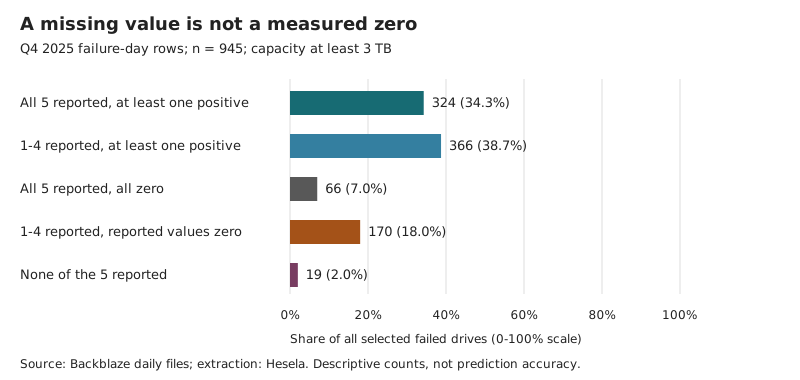
Of 236 failed drives with reported SMART values but no positive reading, only 66 reported all five selected attributes as zero. The other 170 had partial coverage. A missing measurement is not a measured zero.
The counts were right. The description was too strong.
We reprocessed 30,941,708 rows across all 92 daily Backblaze files for October through December 2025. The existing table compares 945 drives on their recorded failure day with 334,842 nonfailed drives present on 31 December, using the same capacity_bytes >= 3e12 selection. This threshold is not a universal HDD classifier. [1] [2]
Every numeric cell in the published 24-row table reproduces unchanged. Its prose incorrectly described 236 zero-only reporting records as having all five attributes at zero. The corrected partition distinguishes incomplete observations from five measured zeros.
| Observed coverage | Q4 failure-day rows | 31 Dec nonfailed rows |
|---|---|---|
| All five reported; at least one positive | 324 | 16,799 |
| One to four reported; at least one positive | 366 | 10,462 |
| All five reported; all zero | 66 | 95,741 |
| One to four reported; reported values zero | 170 | 211,837 |
| None of the five reported | 19 | 3 |
| Total | 945 | 334,842 |
The original result, 690/926 = 74.5%, remains the share with an observed positive value among failed drives reporting at least one selected attribute. It is not the proportion whose complete five-attribute state is known, and it is not prediction accuracy. The original table and Wilson intervals remain available. Those intervals do not repair selection bias.
Complete cases silently become a different fleet
Requiring all five values retains 390 failed drives and 112,540 snapshot drives. Every one belongs to the Seagate model-prefix group. HGST, Toshiba and WDC records in this archive never report the full set. Complete-case filtering therefore changes manufacturer composition as well as coverage. [2]
Only 66 of the original 236 zero-only records establish five measured zeros. Another 19 failed drives report none of the five fields, compared with three in the end-of-quarter snapshot. These counts do not reveal why data is absent. Unsupported attributes, collection problems and device state are different explanations; the aggregate cannot choose among them.
For this audit, a reported value must be numeric, finite and nonnegative. No invalid nonblank SMART value was found in the two selected cohorts. The new checks prevent future malformed data from being silently treated as a valid zero-like reading; they did not change this quarter's numeric results.
A large raw number may contain several counters
The distinction is not only missing versus present. smartmontools 7.5 has model-specific presets that display SMART 188 as three 16-bit words on specified Seagate Barracuda 7200.14 drives. That is not a universal rule for attribute 188 on every model. [4] [5]
A synthetic representation example: three unsigned words equal to 1 combine into 1 + 2^16 + 2^32 = 4,295,032,833. Reading that decimal as billions of timeout events would confuse encoding with meaning. Its positive-versus-zero result is unchanged, but interpreting magnitude requires the matching model and firmware documentation. We did not decode packed fields in this audit.
A raw value also differs from the normalized score compared with a device threshold. Neither is a universal percentage of remaining health.
Failure-day association is not advance warning
Lu and colleagues studied 380,000 drives across 64 sites, selecting devices with SMART, performance and location records. Their FAST 2020 paper explicitly excludes failed-state readings from prediction inputs in section 4; the target is failure within a later window. Section 2.5 separately examines missingness and reports no failed-versus-healthy imbalance in their selected population. Neither finding establishes what caused missing values in our different fleet. [3]
Their main evaluation uses random five-fold cross-validation; they also report errors by time window and test transfer to held-out sites. For a new Hesela prediction study, we would define the observation cutoff, separate device histories appropriately and hold out future periods. We have not trained a model or replicated their reported performance here. See the existing paper analysis.
There is another label constraint. Backblaze's 2014 account says operational replacement decisions could use SMART evidence; its 2016 explanation also distinguishes retirement without failure. These historical sources show why a recorded failure is not automatically a policy-independent physical endpoint. They do not establish the exact decision process for each Q4 2025 event. [6] [7]
The December snapshot excludes nonfailed drives that left earlier and may include drives that entered late. It cannot supply the alert burden or false-positive rate over the whole quarter. Model mix, exposure and the event definition must be aligned before making that comparison.
Reproduce the extraction
Get the original archive from Backblaze, then the audit script and coverage generator. Both use Python 3.11 or newer and the standard library, without network calls or device access.
python3 audit_backblaze_smart.py data_Q4_2025.zip --output audit.json
python3 build_smart_coverage.py audit.json --output-dir results
The manifest records source and generator hashes, runtime, timestamp, counts and five-bit coverage masks in attribute order 5/187/188/197/198. 11111 means five valid values; 10011 means 187 and 188 are absent or invalid. The extractor separately counts blank and invalid fields.
Validation checks full date coverage, required columns, row widths, failure flags, duplicate drive-days, repeated failure events and cohort overlap. All legacy aggregate counts and the original CSV and chart reconcile exactly. The 50-row CSV adds coverage states by cohort and manufacturer, including zero-count states.
Published counts describe this archive, not uncertainty about a larger population. Missingness mechanisms, workload, retirement policy and vendor semantics remain unresolved. No serial numbers or infrastructure identifiers are published; the source archive remains subject to Backblaze's use terms. For age-specific missingness, see the separate age audit.
Sources and evidence boundaries
- Backblaze: Hard Drive Reliability & Test Data (daily snapshot schema, Q4 2025 archive and use terms)
- Hesela: Q4 2025 SMART audit manifest (measured counts, coverage masks and SHA-256 provenance)
- Lu, Luo, Patel, Yao, Tiwari and Shi (2020). Making Disk Failure Predictions SMARTer! FAST 2020, pp. 151-167; sections 2, 2.5, 4 and 5
- smartmontools 7.5 smartctl manual: -A attributes and -v raw-value formats
- smartmontools 7.5 drive database: Barracuda 7200.14 presets for attribute 188
- Backblaze (2014): Hard Drive SMART Stats (What Is a Failure? and SMART 187 replacement policy)
- Backblaze (2016): What SMART Stats Indicate Hard Drive Failures? (failure flags and removals without failure)
Original contribution: independently re-extracted coverage partitions and a correction to an overstrong description. The packed-word example is synthetic; no hardware experiment, causal estimate or model benchmark is claimed.